Comparison of Arabidopsis thaliana with
Saccharomyces cerevisiae, Homo sapiens, and Caenorhabditis elegans
gene lists
Text files extracted from 2D Plots
When the most-dark square is selected on the 2D Plot, the genes which are specific (in the limit of our expectation cutoff in the PyMood BLAST Launcher, e-8) to Arabidopsis thaliana are extracted.
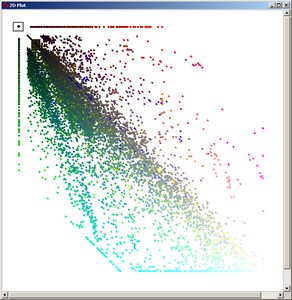
The list of the selected genes were saved as a text file, and then converted into an MS Excel file.
Use the following links to download the list of the Arabidopsis "specific" genes:
Arabidopsis_specific.txt
Arabidopsis_specific.xls
|
By selecting the axially positioned elements, only proteins shared by the query database and one target database were retrieved. When the red axis elements are selected, the list of genes common to A. thaliana and S. cerevisiae were retreived.
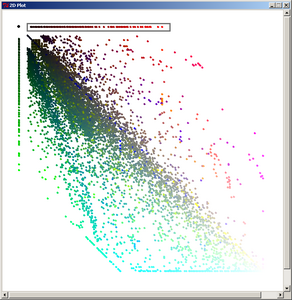
Use the following links to download the list of the genes common to Arabidopsis and S. cerevisiae only:
Ath_sc_specific.txt
Ath_sc_specific.xls
|
When the green axis elements are selected, the list of genes common to A. thaliana and human were retreived.
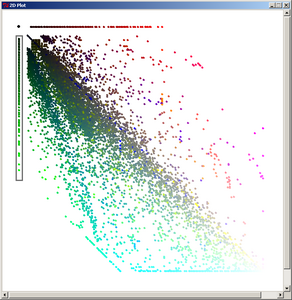
Use the following links to download the list of the genes common to Arabidopsis and human only:
Ath_hs_specific.txt
Ath_hs_specific.xls
|
When the blue axis elements are selected, the list of genes common to A. thaliana and C. elegans were retreived.
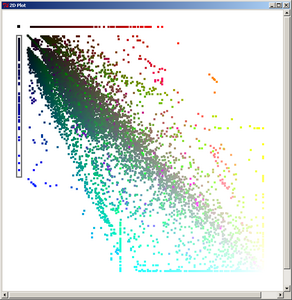
Use the following links to download the list of the genes common to Arabidopsis and C. elegans only:
Ath_ce_specific.txt
Ath_ce_specific.xls
|
Text files extracted from 3D Plots
When a group of the lightest elements (70 to 100 normalized expectation values) are selected on the 3D Plot, the most conservative proteins (within the analyzed group of organisms) are extracted from the data.
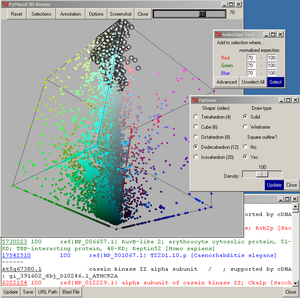
The list of the selected genes were saved as a text file, and then converted into an MS Excel file.
Use the following links to download the list of the most conservative genes:
Ath_most_conservative.txt
Ath_most_conservative.xls
|
When the elements on the red - green plane are selected on the 3D Plot, the proteins common to Arabidopsis, S. cerevisiae, and human are extracted
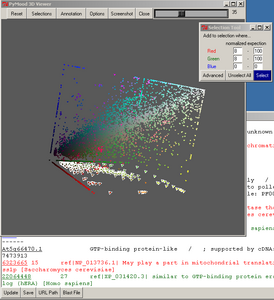
The list of the selected genes were saved as a text file, and then converted into an MS Excel file.
Use the following links to download this list:
Ath_sc_hs.txt
Ath_sc_hs.xls
|
When the elements on the red - blue plane are selected on the 3D Plot, the proteins common to Arabidopsis, S. cerevisiae, and C.elegans are extracted
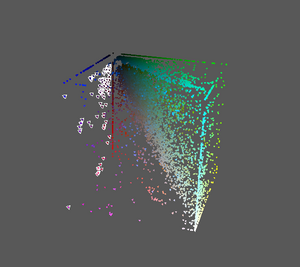
The list of the selected genes was saved as a text file, and then converted into an MS Excel file.
Use the following links to download this list:
Ath_sc_ce.txt
Ath_sc_ce.xls
|
When the elements on the green - blue plane are selected on the 3D Plot, the proteins common to Arabidopsis, human, and C.elegans are extracted
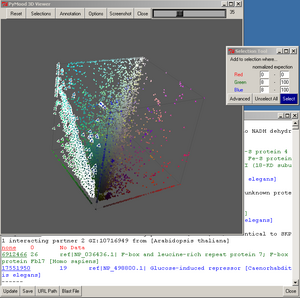
The list of the selected genes were saved as a text file, and then converted into an MS Excel file.
Use the following links to download this list:
Ath_hs_ce.txt
Ath_hs_ce.xls
|
When the elements with approximately equal values for all three coordinates are selected on the 3D Plot, the proteins evolving with about the same speed in Arabidopsis, S. cerevisiae, human, and C.elegans are extracted
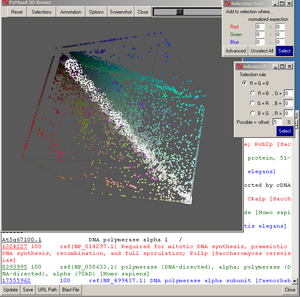
The list of the selected genes were saved as a text file, and then converted into an MS Excel file.
Use the following links to download this list:
Ath_same_diverse.txt
Ath_same_diverse.xls
|
|


