
|

| home | contact | press | arabidopsis | yersinia | fowlpox | mpss | cacao |
browsable canvas of Arabidopsis proteins compared with S. cerevisiae, H. sapiens, and C. elegans proteins (7x7 pixels) - imagemap Arabidopsis proteins are represented by 7x7 pixel squares. The position of every protein reflects the position of the corresponding gene on the Arabidopsis chromosomes/TIGR Fasta file. The protein squares are clickable and linked to the corresponding files in the TIGR Arabidopsis database. The color of the square reflects the degree of the protein sequence similarity to the best hit in S. cerevisiae (portion of the red component in the final color), H. sapiens (portion of the green component in the final color), and C. elegans (portion of the blue component in the final color). Please refer to the PyMood web page for the description of color mixing and to the project web page for the project description. Please do not link to this page. It is an extremely large imagemap and may crash some browsers. When you click on an object, the TIGR database may take 3-15 seconds to be queried. We also have a page with this data with 4x4 pixel elements. 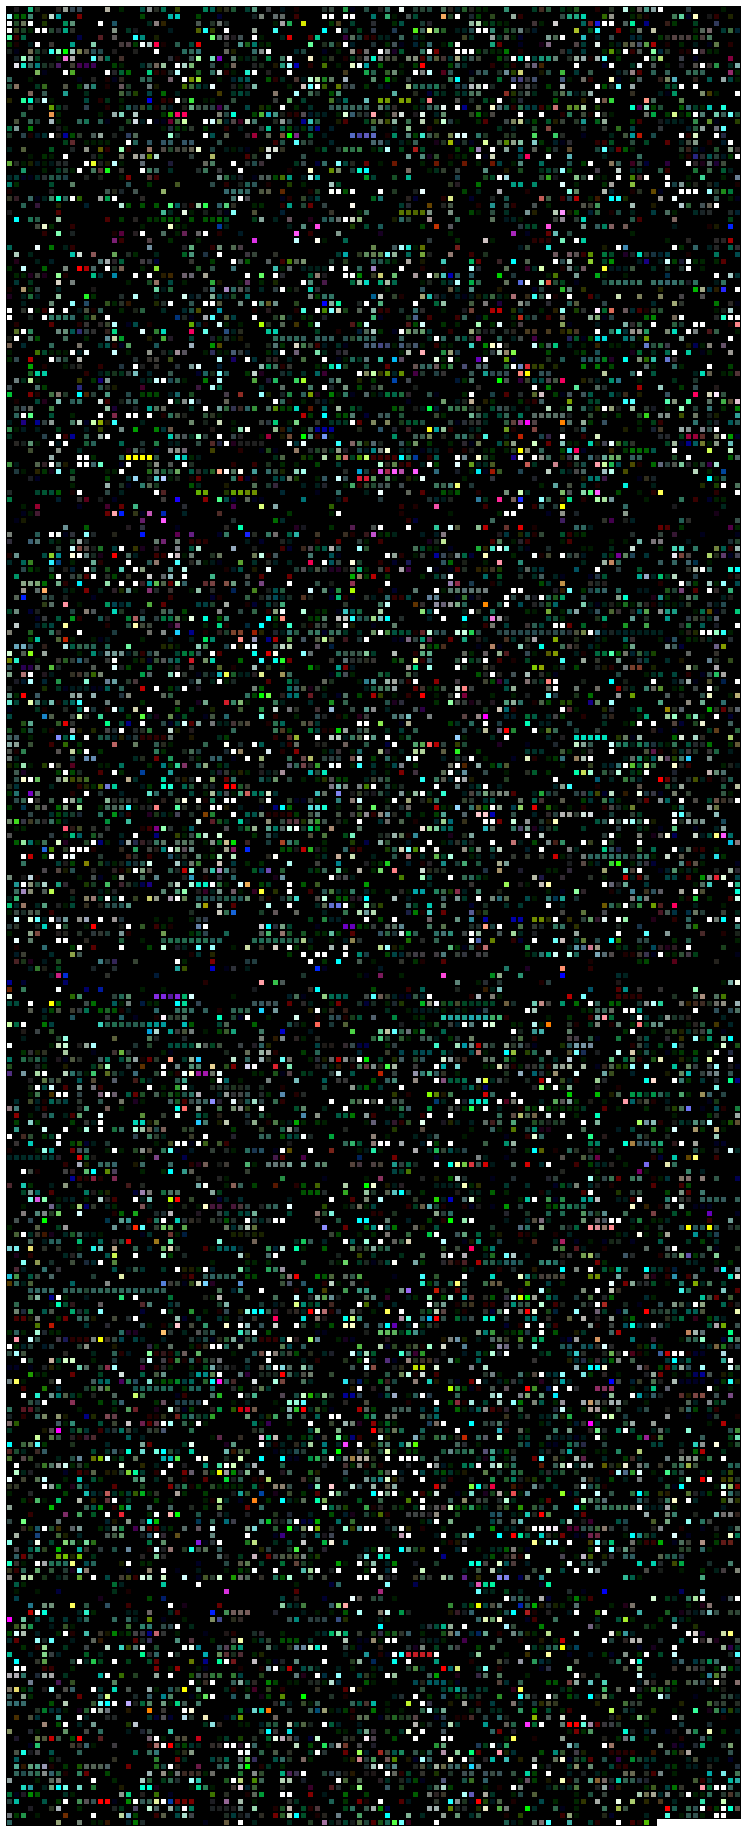
|
|
|