
|

| home | contact | press | arabidopsis | yersinia | fowlpox | mpss | cacao |
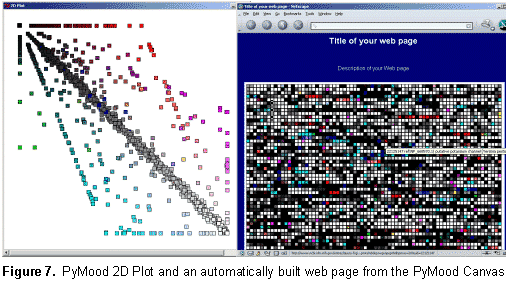
 Genomics Data Visualization Software PyMood is a desktop application for visualizing genomic data. It is used to analyze and display relations between complete genomes, genomic fragments, proteins, ESTs, full length cDNAs, and virtually any sets of sequences. The program is also used to visualize and analyze expression data. The two most common applications of PyMood are visualization of sequence similarities between a query set of sequences with up to three other gene sets, or visualization of expression data from up to three samples. The visualization principle in PyMood is coloring and positioning objects (genes, proteins, etc.) in space according to their data values. PyMood uses additive mixing, meaning it mixes red, green, and blue colors. See the "Mixing Colors" page in our Online Manual for more details. Every dataset has one primary color assigned to it, and every data point gets a color saturation degree according to its data value. The objects are positioned in space according to their three coordinates (Red - x, Green - y, Blue - z). When sequence similarities are displayed, the PyMood pipeline uses parsed data from the blast outputs produced by PyMood Blast Launcher as the spatual coordinates. An example of visualization output is presented in Figure 1. 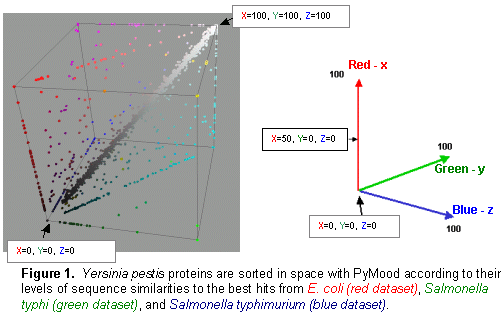 Here, PyMood displays BLAST outputs from the comparison of Yersinia pestis with E. coli K12 (the red database), Salmonella typhi (the green database), and Salmonella typhimurium (the blue database) in the 3D Viewer. Every Yersinia pestis gene has three coordinates according to its similarity to the best sequence hits in the other three species. The darkest objects have coordinates (0,0,0), and in this particular experiment, they are Yersinia pestis proteins that lack homologs in E. coli, S. typhi, and S. typhimurium. The white objects. coordinates are (100,100,100) and they represent the most conservative genes in all four genomes. The 3D output in PyMood can be rotated (Figure 2a), zoomed (Figure 2b) in and out, shifted, and queried (Figure 3). 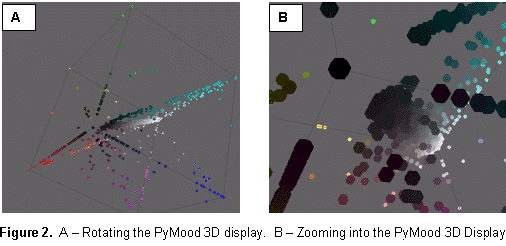 The genes can be selected using three different options that can be combined with each other: "Selection by Range", "Selection by Equality", and "Selection by Search (gene description)" (Figure 3). 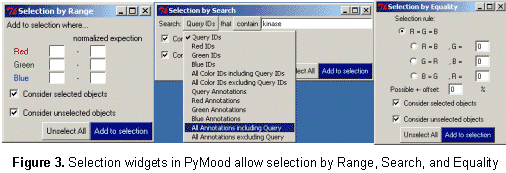 The produced outputs allow visual presentation of patterns in the database, so the user can form the queries based on observed patterns. For example, if someone is interested in retrieving the Yersinia pestis genes evolving at the same rate in all four bacteria (the genes having equally distant homologs in the other three species), the user will simply select the option R=G=B and will input an offset value in the .Selection by Equality. box. The program will select all the genes positioned on the main gray meridian, that start from the darkest element and going to the most white elements (Figure 4). 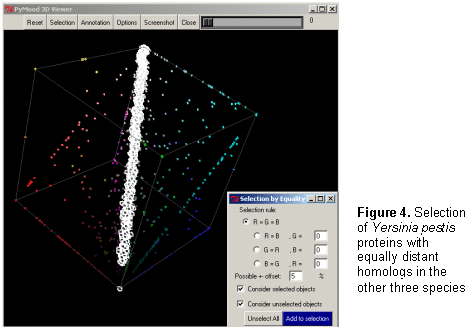 If an expression dataset was presented in this picture, genes selected by R(ed)=G(reen)=B(lue) would be the genes equally expressed in all three conditions, or housekeeping genes. Similarly, by selecting the option B=G, R=0, the user will select the cyan diagonal on the bottom panel (Figure 1). These genes are Yersinia pestis genes with equally distant homologs in S. typhi and in S. typhimurium, but without homologs in E. coli K12. In this particular example, they are good candidates to be the pathogenicity responsible genes. Clicking on the "Annotation" button retrieves the annotation data corresponding to the selected elements. The Annotation window (Figure 5) displays the IDs and Annotations of the selected genes and their best BLAST hits from up to three target databases, and their similarity scores (expectation values or percentage of identity). The IDs are linked to a database of the user's choice (PyMood has a built-in browser). The raw BLAST output data can also be retrieved from the Annotation window. 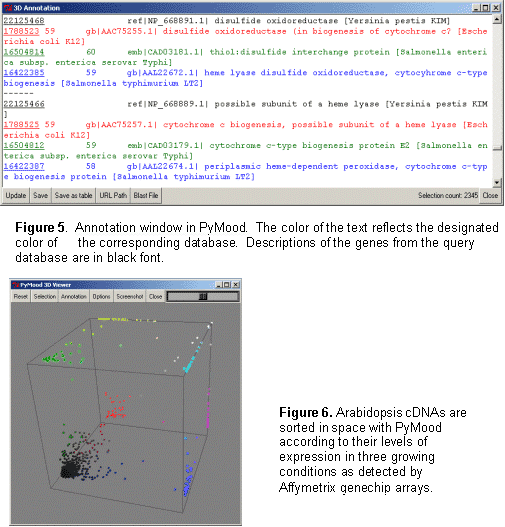 Another example of 3D visualization using PyMood is presented in Figure 6. Here, Arabidopsis cDNAs are sorted in space according to their levels of expression in three growing conditions as detected by Affymetrix genechip arrays. This visualization allowed effortless querying for groups of genes showing distinct expression patterns. This dataset produced clear patterns with well separated groups of genes. The groups can be easily retrieved using PyMood selection widgets. The 2D Visualization capabilities of PyMood include:
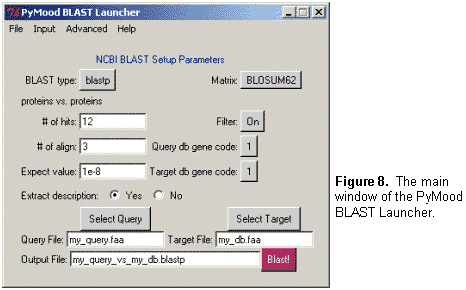
 The other major part of the PyMood package is the PyMood BLAST Launcher (Figure 8), which allows:
 The PyMood package also includes the PyMood Help Browser, and an upgrade tool. PyMood is cross-platform and works on Windows 2000/XP and Mac OS X 10.3/10.4. See our system requirements page for more info. |
|
|